2020 CASE STUDY 4
Urban Green Space
Health Benefits and Reduction of Inequities
Green space, or “greenness”, is an area covered by vegetation like grass and trees that provides a stark contrast to the common man-made surfaces like asphalt found in U.S. cities.
These nature-orientated areas are a key climate change adaptation strategy that can aid in reducing temperatures in “urban heat islands”, or parts of the city that get hotter than surrounding areas due to man-made features (i.e. the urban heat island effect). Green space also provides a multitude of other direct and indirect benefits that promote health.CS_143, CS_144
These health benefits result from reducing harmful exposures to air pollution, heat, and noise, and by promoting physical activity, mental health and social engagement in both children and adults.CS_144, CS_145, CS_146 Epidemiological research also shows exposure to green space can also decrease illness and death.CS_144, CS_145 Other benefits of adding greenness within a city include managing stormwater run-off, increasing plant and animal life, and storing carbon dioxide — thereby combating climate change.CS_147, CS_148, CS_149
Greenness, however, varies across the United States due to weather patterns, urbanization, type of terrain, and other factors. Overall, cities and urban areas tend to be less green than suburban and rural areas due to the number and density of roads and buildings.
Studies show that access to green space in urban areas is not evenly distributed across different races, ethnicities, levels of income, and other social and economic factors – broadly “socioeconomic status” (SES).CS_150, CS_151 Often, areas with a population that is predominantly White with a greater proportion of high income individuals and other beneficial SES factors have more greenness compared to areas of lower SES.CS_150, CS_151, CS_152, CS_153, CS_154, CS_155 Research has also examined how the varying distribution of greenness along racial, ethnic, and economic lines may contribute to health inequities, thus suggesting that access to greenspace is an environmental justice issue.CS_150, CS_151, CS_152, CS_153, CS_154, CS_155
Given that both health and climate change benefit from the creation of green space, urban planners and policymakers can use these findings to support the equitable greening of cities. Action items that can take place at the community level include: a) planting trees and other vegetation that are native, less susceptible to pests, and do not produce much pollen; b) creating a tree and vegetation planting and maintenance plan for neighborhoods, businesses, or cities; c) leading walks in nature to help encourage neighbors to appreciate urban greenspace; d) creating parks and gardens in areas that are lacking these resources; and e) educating public officials about the multiple benefits of greenspace. Some U.S. communities have already started greening initiatives that focus on affordable housing, youth engagement, job creation, and strategies to prevent gentrification and displacement.CS_156, CS_157
BOX 1: Louisville, Kentucky – urban green space access and health inequities
Louisville was found to have one of the most rapidly growing urban heat islands in the U.S. in 2012.CS_158, CS_159, CS_160 Furthermore, the extent of the urban heat island varied significantly within Louisville as temperatures differed by up to 10°F across different parts of the city.CS_159 Concern about urban heat islands, combined with the city’s steady decrease in tree canopy,CS_160 led Louisville to embark on tree planting initiatives like the Green Heart Project.CS_161 Due to these efforts, the city can serve as a useful case study on how a focus on greenness can impact health and other inequities, and how best to further expand greening endeavors.
Although Louisville, overall, has a relatively high average greenness across the city proper and its surrounding metropolitan area, this resource is not equitably distributed. The potential health impacts of this unequal distribution are significant. Using epidemiologic exposure-response functions taken from the literature, we estimated that over 400 all-cause deaths in 2015 for those aged 55 and older could have been prevented with just a small increase in greenness. Of those, about 70 deaths (17%) occurred in areas of very low greenness and 45 (11%) occurred in predominantly Black or low-income neighborhoods.Thus, health can be improved — and lives saved — all while striving to tackle inequities and injustices.
The science: results for the U.S. and Louisville, Kentucky
The 2020 global Lancet Countdown report includes a new indicator measuring access to green space in urban areas.CS_123 The researchers for the global indicator did additional analyses for Louisville, Kentucky to deepen the discussion and understanding of the relationships between greenspace, race, income, and health.
Scientific deep dive: how greenness is measured for U.S. and Louisville, Kentucky
The Normalized Difference Vegetation Index (NDVI) is the most commonly used metric in epidemiologic studies to estimate greenness.CS_144, CS_145 NDVI is derived from satellite imagery and is calculated as a ratio of near-infrared to visible light. In general, it measures the photosynthetic activity of plants, with values ranging from -1 to +1, with negative values indicating water, values around zero representing bare soil, and values near +1 indicating high amounts of green vegetation.CS_162 For this case study, NDVI measured by the Landsat satellite program was processed using Google Earth Engine to calculate average greenness per county for the entire U.S. and per census tract for Louisville, Kentucky.CS_163
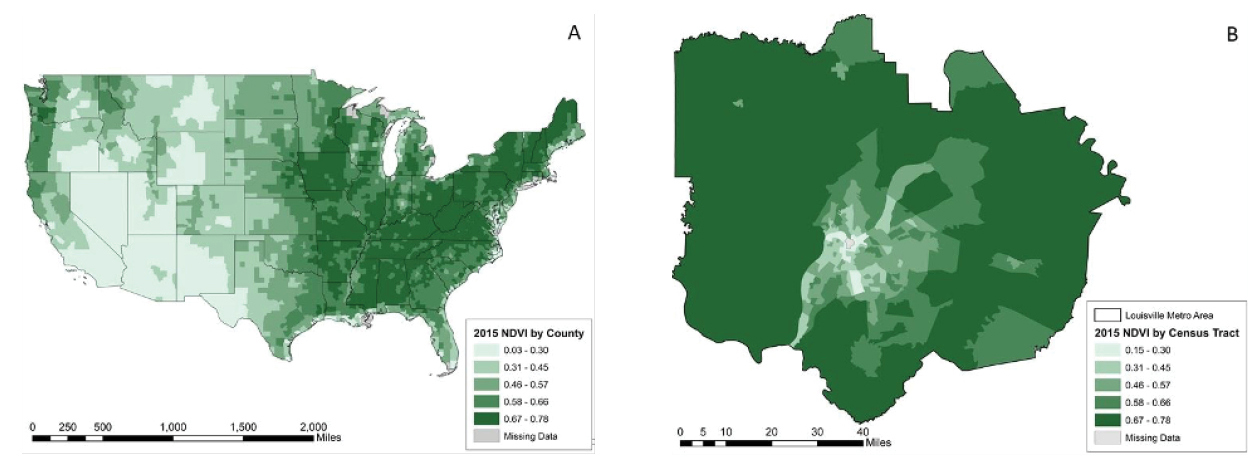
Nationally for the contiguous U.S., the average greenness during the summer months, based on 2015 county-level data, was 0.57 ,with a range between 0.03 and 0.78 (see Figure 1A). Louisville, Kentucky (see Figure 1B) had an average greenness of 0.54 with a range from 0.00 to 0.75. Figure 2B shows that there tended to be less green around the city center compared to the outskirts, which include more suburban and rural land. Louisville fell only slightly below the national average, by 0.03 units.
Figure 1
Distribution of greenness (NDVI) across A) contiguous U.S. by county and B) Louisville, Kentucky metropolitan statistical area by census tract
Scientific deep dive: how the distribution of greenness varies by race and income in Louisville
Residential segregation, or an index of the concentration of extremes, was used to examine greenness exposure inequities along economic and racial/ethnic disparities. Racial (RRS) and economic (ERS) residential segregation are measures that examine how mixed or isolated two populations are within a geographic area.164–166 RRS and ERS were calculated at the census tract level and yielded scores that range between -1 and +1. A value close to -1 indicates the population is concentrated in the deprived group (e.g., non-Hispanic Black and lower income), while a value closer to +1 connotes the population is concentrated in the privileged group (e.g., non-Hispanic White and higher income). Scores close to 0 indicate well-mixed communities.CS_164
Louisville is an example of an urban area with inequitably distributed greenness. In census tracts that are majority White (> 50%), the average greenness was approximately 0.2 units higher than those that are majority Black: 0.56 compared to 0.38, respectively. Similarly, a difference of 0.2 units in average greenness was observed when looking at majority high income (> $100,000 per year) versus majority low income (< $25,000 per year): 0.59 compared to 0.38, respectively.
As Figure 2 depicts, comparing isolated census tracts indicates that more privileged areas (e.g., non-Hispanic White and higher income) have an average greenness 0.2 units higher than the average greenness in less-privileged areas (e.g., non-Hispanic Black and lower income).
Figure 2
Greenness by racial and economic residential segregation in Louisville, Kentucky.

Scientific deep dive: potential reduction in mortality and disparities in exposure to greenness in Louisville
To examine the potential mortality disparities in greenness exposure, a health impact assessment was conducted for this case study. This assessment used a greenness and mortality exposure-response function to estimate the potential reduction in deaths for those 55 years of age and older in Louisville if greenness was increased across the entire case-study area by 0.1 NDVI units.CS_167, CS_168 An estimated overall 413 deaths (95% confidence interval (ci): 309 – 619) could have been prevented in 2015 if the city were able to increase its greenness by 0.1 units, including 71 deaths (95% ci: 54 – 107) in areas with very low greenness (based on distribution in Louisville), and 45 deaths (95% ci: 31 – 68) in predominantly Black or low income neighborhoods.